
Written by @AKWAnalytics.
GREEK PEOPLE VOTE “NO” IN HISTORIC REFERENDUM INCREASING CHANCES OF GREXIT; GLOBAL MARKETS VOLATILE BUT DIRECTIONLESS.
As the Greeks stand in defiance of the Troika, financial markets are having a difficult time digesting the news. It is still unclear to market participants what the ramifications of the Greek actions will be, but it is fair to say that uncertainty is running high. Will the Euro strengthen with a weak link gone from the chain, or will a Grexit empower other debtor nations (PIGS) to stand in opposition to Brussels? At this point anything is possible, but our suspicion is that the Eurocrats will do everything in their power to stem a market event for as long as possible (appearance of a deal, “kicking the can”). In fact, investors are already looking forward to the IMF payment due from Athens on July 20th, so we think markets remain range bound until then.
Markets don’t like uncertainty, and there is a bounty of it around the globe right now. China’s government is attempting to keep their bubbly stock market propped up via loose margin and market manipulation, Puerto Rico is still broke, and it seems that everyone remains clueless as to when the US Fed will actually raise rates. We are going to stay on the sidelines until markets give us a clearer signal as to longer term directional bias.
Forex
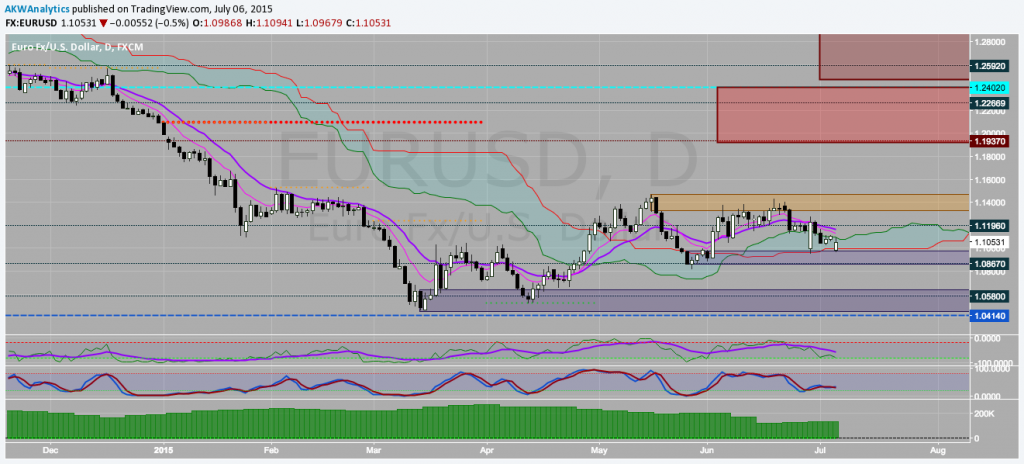
If you look at an intraday chart of EURUSD, it looks like a wild day! A gap open on the Greek vote got filled quickly (again) before the bears stepped back in to keep price in a tight range. Moving to the daily chart, we can see that relative to recent price action, today was rather tame. Price remains well within our supply and demand areas, as well as the the Ichimoku Cloud, while the momentum indicators show indecision in the market.
The ranges we identified last week remain valid and will be until there is a clear break on the daily chart. In fact, if you are inclined to trade ranges, finding a spot within the next 200 pips to the downside to get long might not be a bad idea, especially if the previous bullish order block can hold (price is right on it following today’s action). The range is from a demand level around 1.10 up to a supply zone in the 1.132 to 1.147 range. Until one of these areas is cleared on a clean breakout, then we must assume that we are trading in a range on Fiber.
Fiber Daily
Stocks
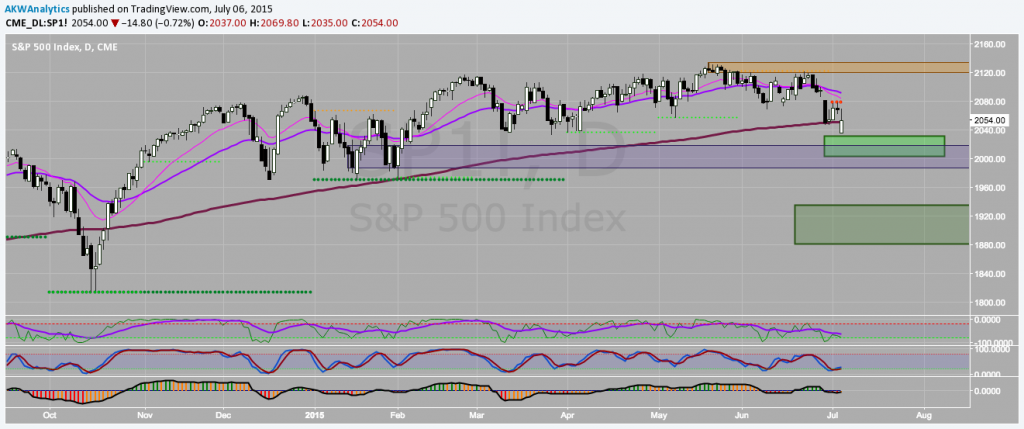
What a brutal start to the week for US stocks as the S&P 500 was down over 1.5% in overnight trading on Sunday before recovering a large portion of those gains in the New York session today. It is no surprise to us that US investors BTFD, as they have been well trained to do, but looking at the technicals shows it really might be different this time.
Despite the rally during the day today, we can see that the 200day MA was broken for the first time in months, and failed on a retest. Not only that, but SCMR is now painting building resistance around the 2080 level, the institutional EMA’s have crossed to the downside, and momentum indicators are confirming bearish bias. That said, price is already approaching a strong support region at the daily OTE long zone (green box) and previous demand area, not to mention a big fat round number at 2000, so getting short now is risky. We are not sure whether we want to be buying this dip just yet, but it will be on our radar if prices get down to that 2000 level.
S&P500 Daily
Metals
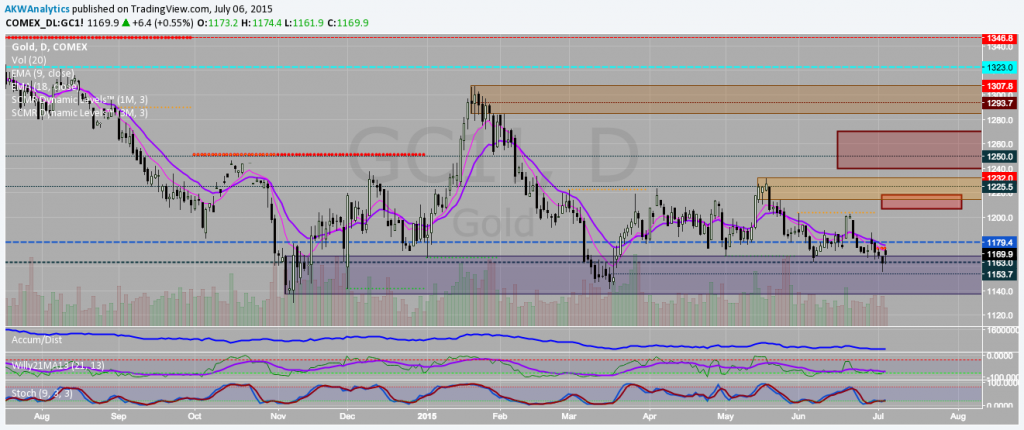
It seems that Gold still can’t get out of its own way despite what you would think are perfect conditions for a precious metals rally. However, upon further inspection we realize that the crisis in the Eurozone is not monetary, but political. The euro continues to trade relatively well despite the turmoil, and Greek capital controls are not indicative of a currency crisis, but a politically driven liquidity one. Perhaps this is why bitcoin is outperforming gold by such a wide margin over the past few weeks. Its benefits are clear in the face of the Greek calamity.
The charts confirm this bearish bias as resistance builds around the 1175 $ area, right where the rally petered out today. Additionally, the institutional EMA’s remain bearish and A/D continues to show gold be distributed rather than accumulated. One thing the bulls can cling to is that price is now entering a longer term demand area and OTE long zone, but the price action has been so poor that we find it hard to imagine gold catching a bid anywhere past 1200 $, even on a panic. Again, watch bitcoin for alpha and for clues regarding Europe, not gold.
Gold Daily
Happy Trading!
Cheers,
@AKWAnalytics
—
To learn more about the BullBear Analytics, or to gain access to our full line of Weekly Reports, Daily Updates, and real-time Price Alerts for bitcoin and other cryptocurrencies, please visit bullbearanalytics.com today!

For more information on the Bitcoin BullBear and Crypto BullBear, or on how to subscribe to our Premium Services, please visit BullBear Analytics today!
Join Today for Full Access!
Happy trading and have a great BITday!
Disclaimer: Please always do your own due diligence, and consult your financial advisor. Author owns and trades bitcoins and other financial markets mentioned in this communication. We never provide actual trading recommendations. Trading remains at your own risk. Never invest unless you can afford to lose your entire investment. Please read our full terms of service and disclaimer at terms-conditions-disclaimer/.