
Origininally published in the Bitcoin Bull Bear Digital Currencies and Financial Markets Report on 10/30/2013
Market Outlook:
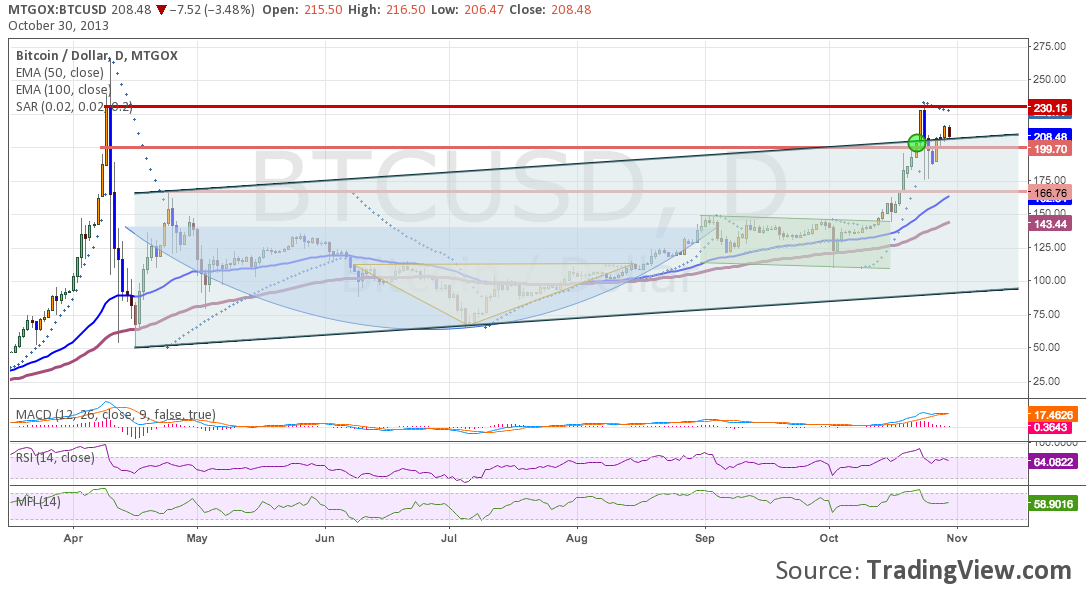
Bullish Continuation. Our previous option (A), inverse head and shoulders pattern, developed as predicted and foretold the move from 110 to 148.50 $. In addition, the textbook cup and handle pattern identified prior to the recent breakout rally materialized as predicted and foretold the move from 144 to 230 $. Since we identified the formation about a month ago, it has lived up to its reputation as a very reliable continuation pattern. Now that the aforementioned patterns have been resolved to the upside the market remains in a medium term uptrend, although there is the lack of a predominant chart pattern other than the possibility of a flag or pennant forming short term (still too early to tell). Other aspects of the chart remain bullish as the MACD is still heading higher, the RSI and MFI are no longer overbought, the EMA’s are accelerating, and trendline support (top of the longer term channel) has held after a small dip below it. Given the outlook provided in the Short Term section below, we believe the market will continue to rally up to 233 $ and eventually 266 $ following the sideways action. Probability XX/XX.
BTC/USD Daily Chart from Oct 30, 2013:
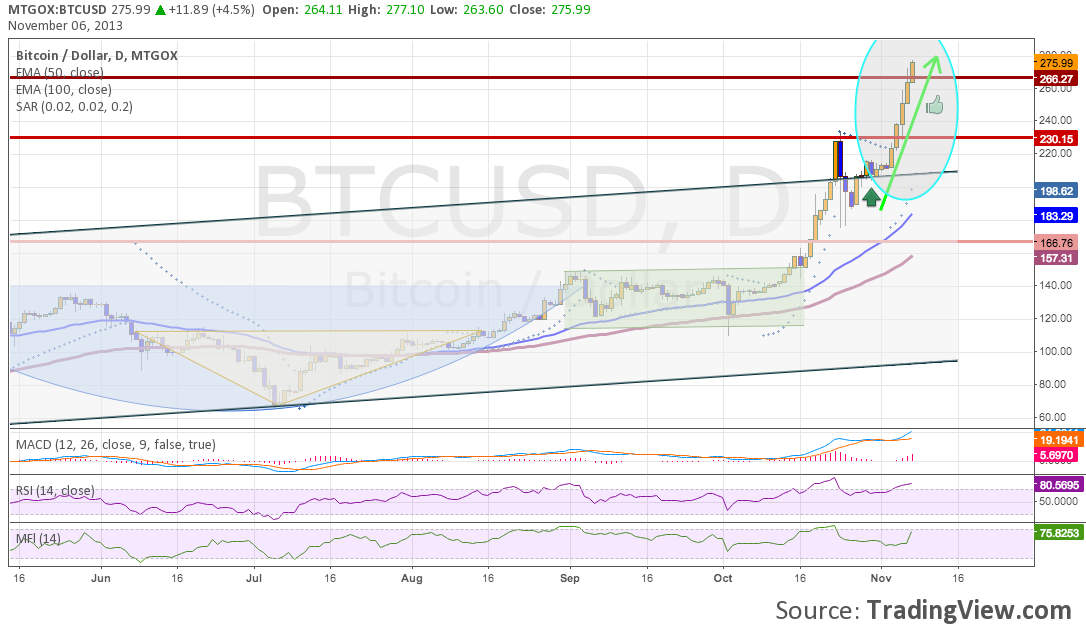
BTC/USD Daily chart from Nov 6, 2013:
For more information on the Bitcoin market, or any of the other markets we cover (Litecoin, Gold, Silver, S&P 500, DAX 30) please visit Digital Currency Research. Happy trading!