Today we are bringing you our Bitcoin market analysis along with a primer on what Bitcoin is, the technologies it takes advantage of, the exchange marketplace landscape, and how to begin to trade it using technical analysis.
Currency name: Bitcoin (BTC)
Genesis Block: January 3, 2009
Total Supply: ~21 million
Algorithm: PoW (SHA-256)
Features: Security, Store of Value
Website: https://www.bitcoin.org
Bitcoin is a digital asset and a payment system invented and created by an unidentified programmer, or group of programmers, under the name of Satoshi Nakamoto. Bitcoin was introduced on 31 October 2008 to a cryptography mailing list and released as open-source software in 2009. There have been various claims and speculation concerning the identity of Nakamoto, none of which are confirmed. The system is peer-to-peer and transactions take place between users directly, without an intermediary.
These transactions are verified by network nodes and recorded in a public distributed ledger called the blockchain, which uses bitcoin as its unit of account. Since the system works without a central repository or single administrator, the U.S. Treasury categorizes bitcoin as a decentralized virtual currency. Bitcoin is often called the first cryptocurrency, although prior systems existed and it is more correctly described as the first decentralized digital currency. Bitcoin is the largest of its kind in terms of total market value.
Bitcoin tokens are created as a reward for payment processing work in which users offer their computing power to verify and record payments into a public ledger. This activity is called mining and miners are rewarded with transaction fees and newly created bitcoins. Besides being obtained by mining, bitcoins can be exchanged for other currencies, products, and services. When sending bitcoins, users can pay an optional transaction fee to the miners.
This explanation from the Wikipedia article on Bitcoin sums up the idea and functionality behind this coin surprisingly well. The only thing we would like to emphasize more is the fact that what makes this network so special, and what separates it as the only true and public blockchain, are its monetary properties. Limited supply, divisibility, durability, security, and immutability are all properties of the network which are also desirable properties of money. This is by no means a coincidence, so it is no surprise that Bitcoin is still the only cryptocurrency to be used in real value-add transactions (that is, in a money-like way).
Additionally, the extensibility of the protocol to include things like smart contracts and sidechains is attractive for long term investors. However, all must realize that the true value proposition for the token is primarily monetary in nature, and not technological like most people think. Keeping an eye on this feature will keep us focused on the fundamentals that are driving the price action on a day to day basis, and allows us to stay focused on what really matters to us, the technicals.
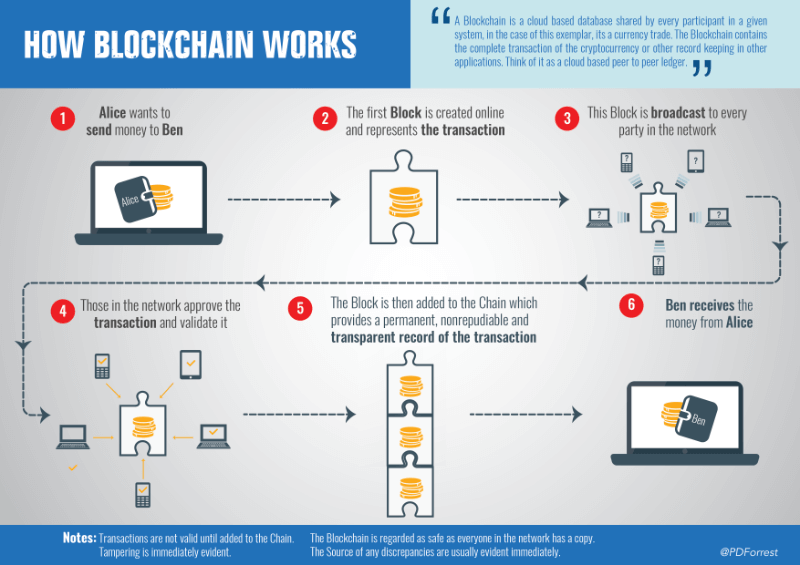
While conducting our Bitcoin market analysis research, we have established that transaction record-keeping via a blockchain and Proof of Work mining are at the heart of the technological advancements presented to the world by this network. Not only do these features allow for the tokens to function on a day to day basis, but they also keep stakeholders' incentives aligned almost 100% of the time without an intermediary, authority, or third-party of any kind. This is unprecedented in human history. For more detail on the specifics of these two pieces of technology, we return to the Wikipedia article on blockchain:
"The blockchain is a public ledger that records transactions. A novel solution accomplishes this without any trusted central authority: maintenance of the blockchain is performed by a network of communicating nodes running the dedicated software. Transactions of the form payer X sends Y bitcoins to payee Z are broadcast to this network using readily available software applications. Network nodes can validate transactions, add them to their copy of the ledger, and then broadcast these ledger additions to other nodes. The blockchain is a distributed database – to achieve independent verification of the chain of ownership of any and every amount, each network node stores its own copy of the blockchain. Approximately six times per hour, a new group of accepted transactions, a block, is created, added to the blockchain, and quickly published to all nodes. This allows the software to determine when a particular bitcoin amount has been spent, which is necessary in order to prevent double-spending in an environment without central oversight. Whereas a conventional ledger records the transfers of actual bills or promissory notes that exist apart from it, the blockchain is the only place that bitcoins can be said to exist in the form of unspent outputs of transactions."
Next up is Proof of Work mining:
"Mining is a record-keeping service. Miners keep the blockchain consistent, complete, and unalterable by repeatedly verifying and collecting newly broadcast transactions into a new group of transactions called a block. Each block contains a cryptographic hash of the previous block, using the SHA-256 hashing algorithm, which links it to the previous block thus giving the blockchain its name.
In order to be accepted by the rest of the network, a new block must contain a so-called proof-of-work. The proof-of-work requires miners to find a number called a nonce, such that when the block content is hashed along with the nonce, the result is numerically smaller than the network's difficulty target. This proof is easy for any node in the network to verify, but extremely time-consuming to generate, as for a secure cryptographic hash, miners must try many different nonce values (usually the sequence of tested values is 0, 1, 2, 3, ...) before meeting the difficulty target.
Every 2016 blocks (approximately 14 days), the difficulty target is adjusted based on the network's recent performance, with the aim of keeping the average time between new blocks at ten minutes. In this way, the system automatically adapts to the total amount of mining power on the network. Between 1 March 2014 and 1 March 2015, the average number of nonces miners had to try before creating a new block increased from 16.4 quintillions to 200.5 quintillions.
The proof-of-work system, alongside the chaining of blocks, makes modifications of the blockchain extremely hard, as an attacker must modify all subsequent blocks in order for the modifications of one block to be accepted. As new blocks are mined all the time, the difficulty of modifying a block increases as time passes and the number of subsequent blocks (also called confirmations of the given block) increases."
In essence, the blockchain and mining processes together act as a decentralized clearinghouse for a monetary transaction involving the token, making them censorship-resistant, global, inexpensive, and fast. In our opinion, this is disruptive and potentially revolutionary, enough so that we felt as though it deserved full-time financial market coverage (hence BullBear Analytics' creation!).
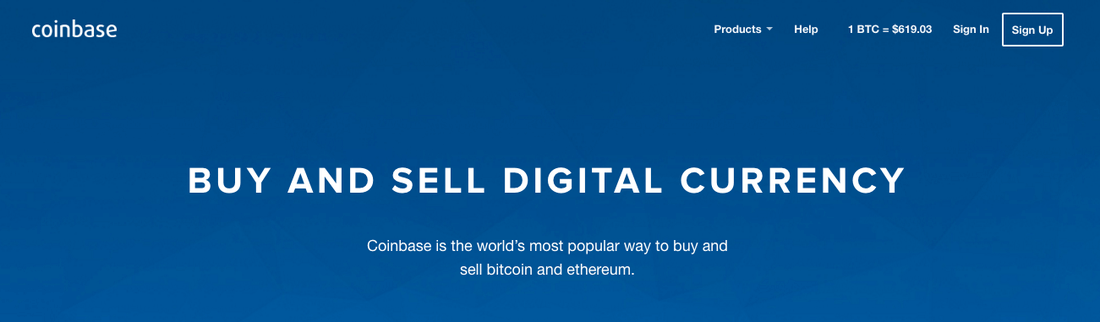
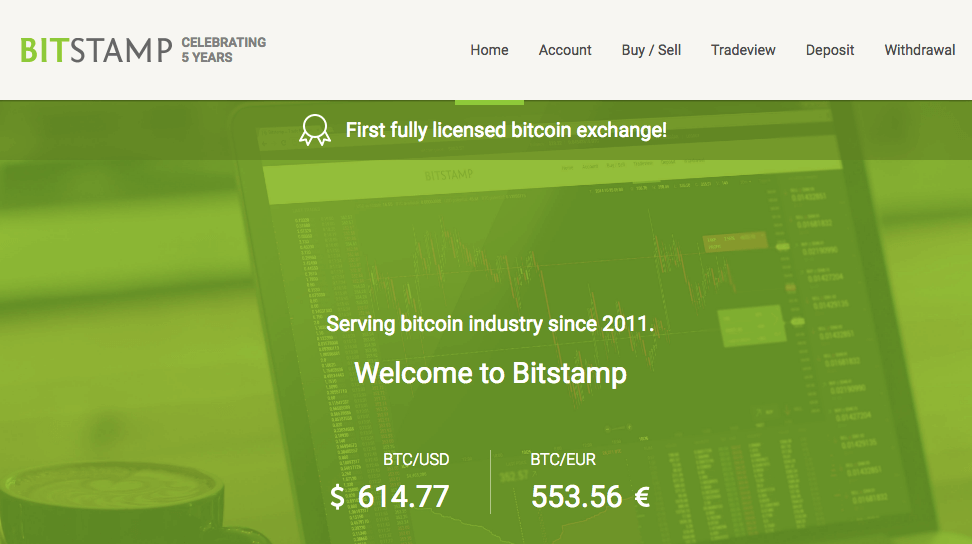
In our Bitcoin market analysis, we have seen that this coin is still by far the most widely traded and most liquid cryptocurrency in existence. Altcoin exchanges use it as a reference currency for almost all trading pairs, and there are many fiat-to-bitcoin exchanges and wallets around the globe. It is considered the on-ramp into the crypto economy and conversely is considered an exit point for fiat currencies. Some of the biggest exchanges are listed below, Coinbase and BitStamp, but there are numerous other places to trade it if these are unavailable in your area.
While looking into price action in our Bitcoin market analysis, we have seen that it acts very well on all timeframes. Both scalp trades and swing trades off of local and regional highs and lows can be profitable for those with agility and objectivity, while longer-term traders will find the slower action (relative to altcoins) welcoming. BBA has been covering Bitcoin since it began having a market price in 2010 and has executed on many highly advantageous setups on both the long and the short side over the past few years so our familiarity with this coin and its markets is truly unmatched.
The aforementioned trade setups have been and continue to be determined almost entirely via BBA's proprietary technical analysis of the charts, although we do take a fundamentally bullish longer-term view of this particular market. BBA synergizes analysis from multiple timeframes that stretch from the very short term (minutes/hours) to very long (years), which is unique in the world of cryptocurrencies due to their current nascent nature. We believe that taking both a broad survey of the trading landscape, as well as a detailed look at each perspective individually is the only way to get a clear picture of what is going on in the market.
Below we will take a quick look at some of the more basic tools BBA uses to evaluate the Bitcoin markets on a day to day basis.
The primary vehicle via which all technical analysis is performed is known as the chart. A market chart simply tracks price movements over a specified period of time. Below is an example of the most common type of financial chart, the candlestick chart.
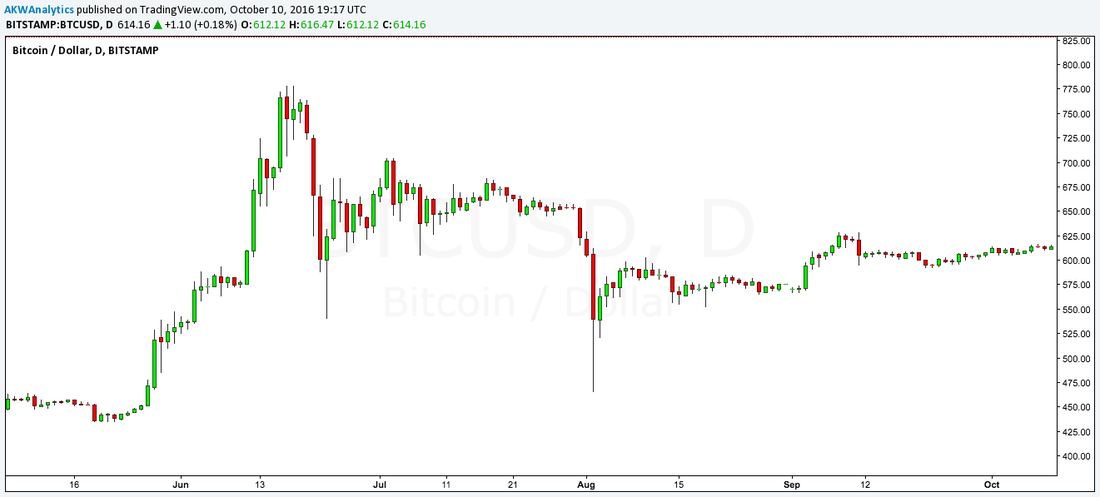
Along the X-axis is the timeframe and along the Y-axis is the price of the security. Each “candlestick” represents a summary of the price action within a given period of time (in this case, a day). The very top and bottom of the line extending through each candlestick are the highs and lows for the given time period, and the body of the candlestick is where prices opened and closed during that time period.
There are many more types of charts that we will get into in future educational material such as Renko, Kagi, and point and figure charts, but we have just enough to move forward for now.
There are a theoretically infinite amount of potential timeframes (TF's) we could analyze for any given market, however there are some common ones that a majority of market participants and technicians use for their analysis: the monthly, weekly, daily, 4-hour (240min), 2-hour (120min), 1-hour (240min), 30 minute, and the 15 minute charts. We occasionally use the 1 and 5-minute charts when markets are moving fast, however during normal market conditions they provide too many false signals to make them truly effective.
To give you a better idea of how much of an impact these timeframes can have on how we view the market we will be showing a series of charts, all of Bitcoin, in which we will describe what is occurring in each one. First, let's look at the shorter term as this is usually where most new traders and investors begin (hint: do the opposite! We always approach the market from the top-down, meaning we start from the highest TF and work down to the lowest).
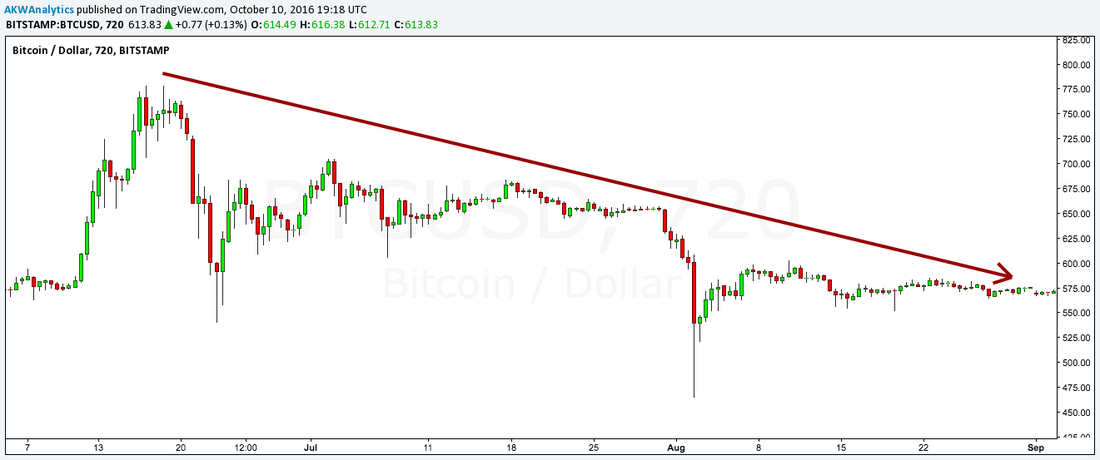
As you can clearly see, this market is heading down. If you were unaware of what security this is referencing or in what temporal context this is, you would definitely say this is a bear market (a bear market is defined as a 20+% move down from the highs). In a vacuum, this security looks like it is most certainly heading lower, however, lets back up a step and look at a slightly longer timeframe.
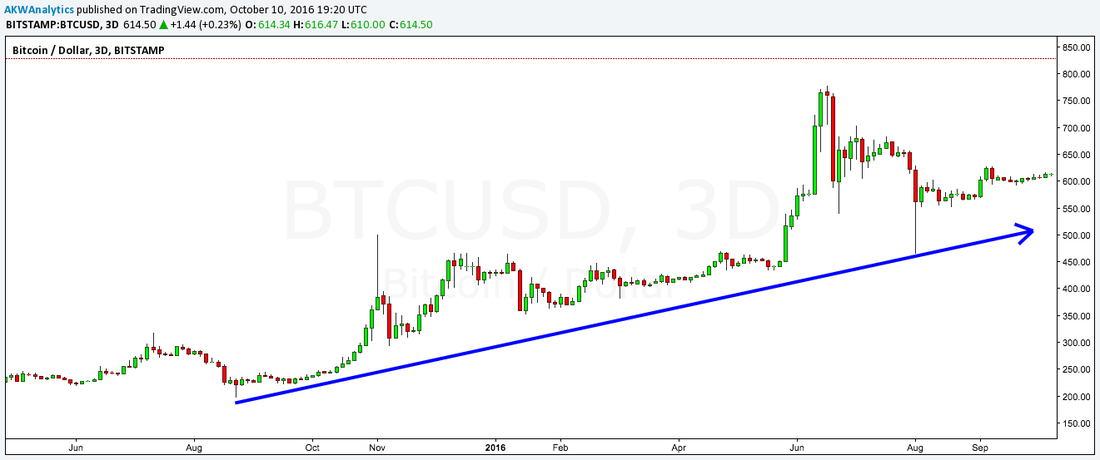
Now it doesn’t look as bad, right? From this perspective, the market appears to be in a bull market, whereas on the 12-hour chart above we were most certainly in a bear market. What a difference an adjustment to timeframe can make! Let's zoom out, even more, to see what happens when we look at price action in its entirety.
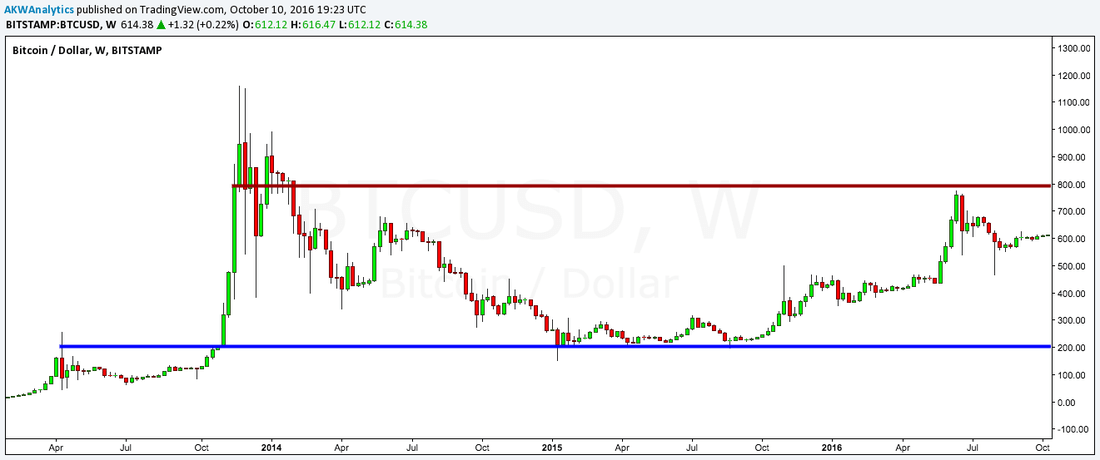
Wait, what is going on here? Well, if we step back to this longer-term view we can see that in fact, the market was in a trendless consolidation since becoming a liquid asset back in 2013, and it remains so today despite bouts of upside and downside volatility. It’s pretty amazing how simply changing the length of time that we are analyzing can have such a dramatic effect on how we view and potentially trade the market.
One of the most basic, but perhaps most important, tools that technicians utilize are lines of support, resistance, and trend. These are important because they give us reference points to key off of as we trek through these frontier markets.
Let’s start by defining terms which are often misused so that we are all starting from the same place. Support levels (lines) are prices at which there should be a floor underneath the market due to buyers clustering around historically significant levels. Resistance refers to price levels at which there should be a ceiling on the market as sellers tend to cluster around historical levels above the current market price. When we refer to trend, we are simply talking the direction in which the market is heading over a specific timeframe (think back to our discussion on Timeframe). The market can either be moving from the lower left to the upper right on the chart (bullish), from the upper left to the lower right (bearish), or within a range between support and resistance levels.
One more thing to discuss is the idea of a breakout or a breakdown, depending on directionality. A breakout typically refers to a situation in which prices move above a well-known resistance level thus having the effect of accelerating the move higher. Conversely, a breakdown occurs when a well know support level is breached to the downside, thus having the effect of driving prices even lower at a faster rate.
Now that we have that out of the way, let’s get to some examples so that you can see how useful these tools can be!
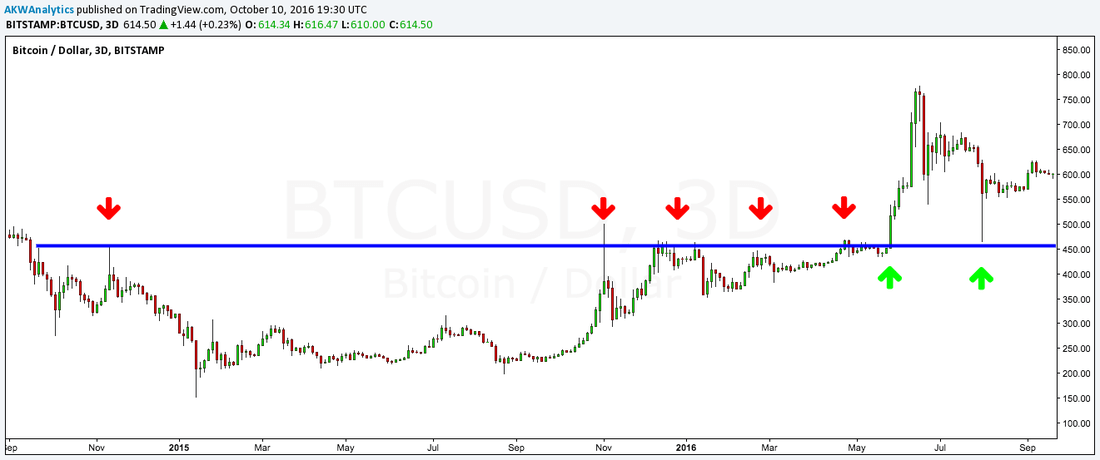
You can see that we have identified the $450 level as an area of serious resistance lasting from September of 2014 to late May of this year (2016) which was tagged five times prior to a breakout! This is typical when markets are attempting to move above longer-term resistance, just know that the more times a level is touched the more likely it is to be broken.
Also of note is the fact that shortly after the 450 $ level was taken out and the market moved higher, that resistance level then became support on the next substantial selloff (known as a test of support). Since then, $450 has been supporting going forward and will remain so until it is broken to the downside once again.
Next up we'll take a look at the trend.
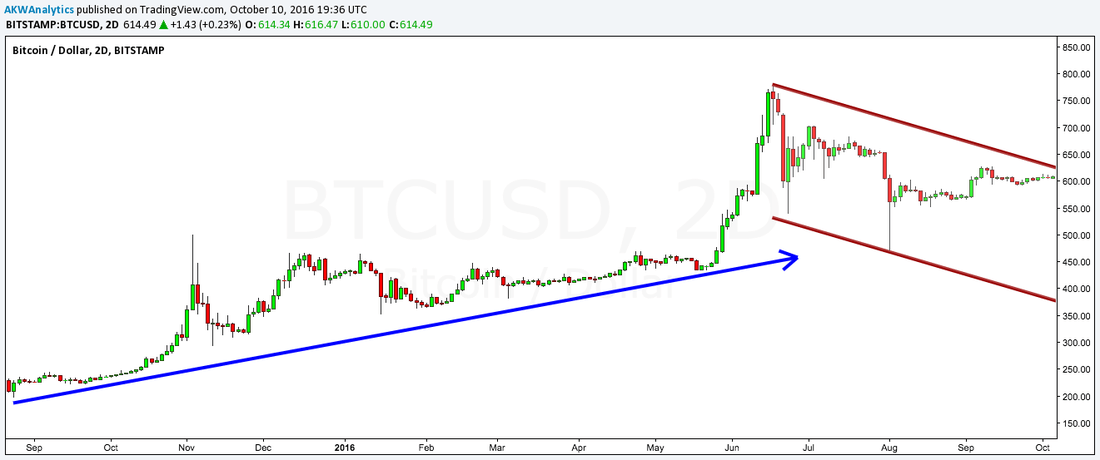
It is pretty difficult to misinterpret this chart, which is one of the great things about trend analysis: that it is simple and straightforward. You can see that from the September 2015 low to the June 2016 high the market was in a clear and tradeable uptrend, as well as a Wyckoff sell model. Then from June on through today, the market has been in a downtrend that looks to be a bullish consolidation pattern. As far as the trend channel goes, the implication is the same whether the trend is up or down. A break above the upper trendline means the market is heading higher, while a break below the lower trendline and down she goes.
In this instance, we have yet to break above the current trading channel so there is no reversal signal yet, however, it is very close so once that occurs you can bet that buyers will return to the market to drive it higher. Again, these are very informative, yet easy to implement and interpret tools that can provide invaluable insights into how you should be positioned in a given market.
The final aspects of Bitcoin trading that we want to explore are the ideas of momentum and volume. Tools that allow us to track and analyze price momentum and trading volumes are often referred to as "indicators", and they come in a variety of forms that range from mathematical moving averages to adjusted measurements of buying vs. selling volumes.
Before we delve deeper into this topic we must warn you that there are literally hundreds of different indicators, all of which examine the market in a slightly different way. For our purposes, which indicator is used will be less important than being able to recognize the trend and identify what are know as "divergence" patterns. This is due to the fact that each indicator is calculated differently, but they all tell essentially the same story.
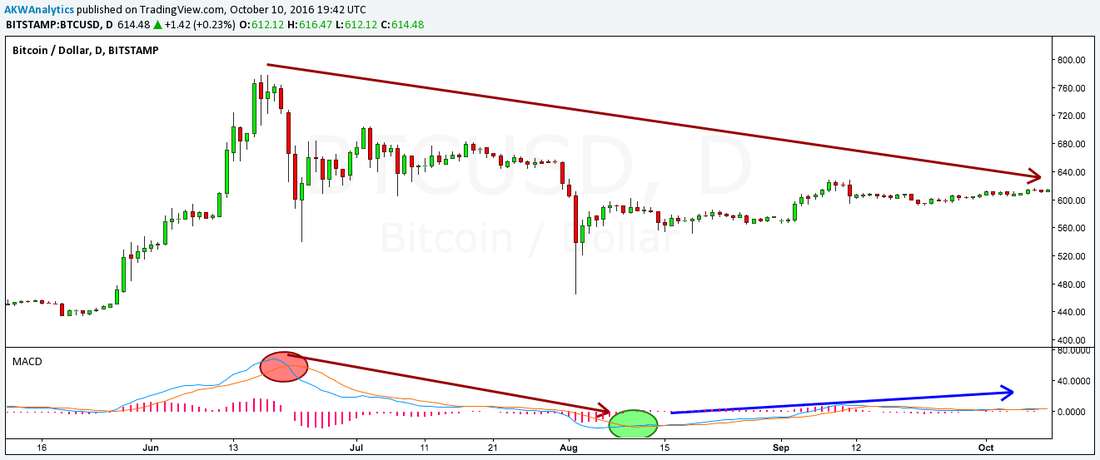
Below we will be showing some examples of what are some of the most popular and applicable indicators for active traders. We will start with the MACD as it is probably the most popular indicator these days. The MACD consists of two lines and a histogram. You can interpret this indicator in a number of ways. First, when the shorter MA line crosses over the longer MA line it means that a reversal could be occurring. Next, a zero-line crossover can be interpreted just like any other crossover in that when zero is crossed coming from the downside to the upside, this is a bullish confirmation (and vice versa).
Additionally, when the MACD is trending with the overall market price then the current trend is being confirmed by MACD. On the other hand, a divergence between market price and the indicator signals that a change in pattern is occurring and a reversal in trend is becoming more likely.
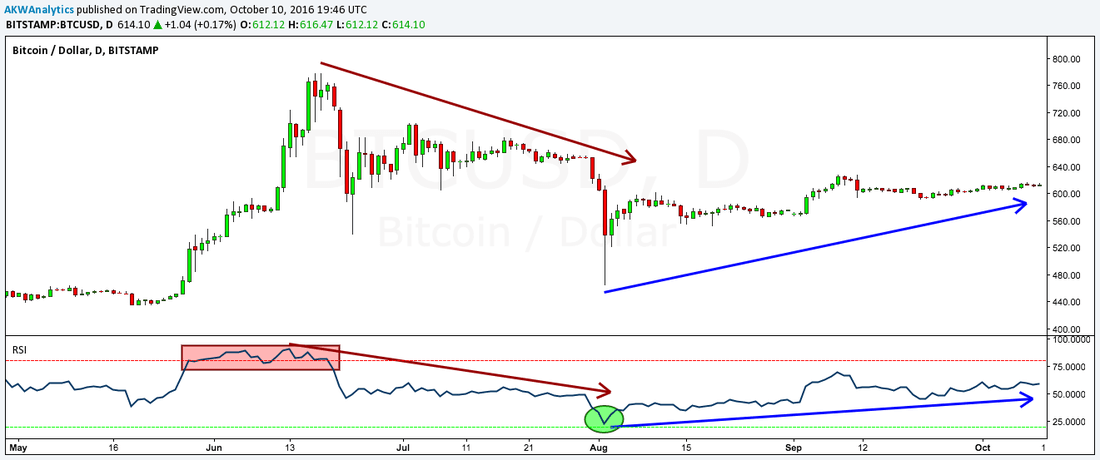
Next, we show the Relative Strength Index (RSI) which is interpreted the same way as MACD, except that the RSI adds numerical values to overbought and oversold levels. You can see on the chart below that as the RSI moves closer to the oversold territory (20 and below) at least a minor rally ensues, and when the market is approaching overbought (over 80) a pullback materializes.
Lastly, here are indications of volume, the main one being a simple running total of exchange volumes known as "volume". There are also volume indicators which account proportionally for buying and selling volume, one of the most popular of which is the A/D line (Accumulation/Distribution line). Like momentum, the main thing to keep an eye out for here is divergences from the prevailing price trend as this is a sign that there may be more or less conviction behind a move than it would appear on the surface. We can see an example of this, as well as examples of the A/D line and volume profile, on the chart below.
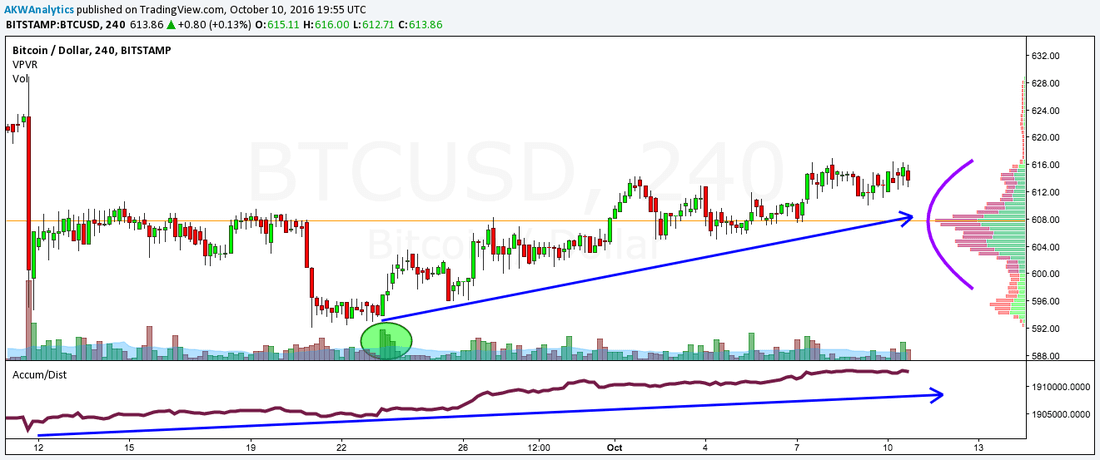
Notice that volume was confirming the downtrend in late September, but was also progressively divergent hinting at a diminution of buying power up to the point where price reversed on a bullish volume breakout. Additionally, the volume has been relatively low during the correction indicating this is an extended bull market consolidation, while the bullish trend on the A/D line recently is confirming the rally. Finally, the volume profile looks pretty good however there is a notch around $600 which might need some filling in prior to a resolution higher. Volume is an important confirmation tool for any technical trader so reading the signals on these indicators is a valuable skill for analyzing Bitcoin.
Combining trend analysis, support and resistance levels, momentum and volume indicators, and a knowledge of how to interpret these signals gives us a solid foundation from which to create a profitable trading plan, not just for bitcoin but for any market.
Despite its older heritage and relatively languid price action recently, Bitcoin remains the undisputed champion of the cryptocurrency markets until further notice. It's large and consistent liquidity, diverse exchange ecosystem, simple yet admirable foundations, and technical obedience all make it the best candidate for investors and traders looking for a more traditional market within this frontier space. You still get outsized opportunities on both the long and the short side while liquidity spikes become less common due to trading volumes, all of which makes trading this token for profit one of the fastest-growing segments of the trading industry. We think there is nothing but growth ahead for this asset, and other assets like it, which is why we have made it a career covering it in detail.
Subscribe to BullBear Analytics today to see how we apply these principles to everyday activities in the cryptocurrency markets, and to find out what makes our success so sustainable.
The crypto space is growing large, and it is difficult to keep information about all the various networks/assets straight. We do our best, but information on this page has not been verified for accuracy, and is provided as-is, for your own consumption. If you find an error that needs correcting, please email us at [email protected].
Disclaimer: Please always do your own due diligence, and consult your financial advisor. Author owns and trades bitcoins and other financial markets mentioned in this communication. We never provide actual trading recommendations. Trading remains at your own risk. Never invest unless you can afford to lose your entire investment. Please read our full terms of service and disclaimer at the BullBear Analytics Legal.